


Dify 1.5.0: Real-Time Workflow Debugging That Actually Works
Dify 1.5.0 eliminates workflow debugging guesswork by saving what nodes produce and tracking variables live. Developers can now test individual steps instantly without expensive reruns or manual input, turning guesswork into precision.


Building AI applications means handling complex logical chains. Your production workflow might start with a knowledge retrieval node, call tools for real-time data, run reasoning through multiple LLM nodes, then integrate everything with a template node. It is powerful, but debugging these workflows is tough.
When your final output misses the mark, one question matters: where did things break? RAG might have grabbed irrelevant documents, tools could have returned bad data, or LLM reasoning simply went astray... Traditional workflows operate as black boxes.
You feed inputs at one end, wait for results at the other, and hope it works. When problems hit, you are stuck digging through logs and rerunning entire workflows. It is a process built on guesswork rather than insight, burning both time and API costs.
Developers need transparency and control, not log hunting. And that is why Dify 1.5.0 brings a rebuild of workflow construction and debugging, trying to turn AI app development into real-time iteration.
Previous Limitations
Dify offered single-step execution before, letting you test individual nodes separately. But this approach had clear limits:
- No result storage: Node outputs vanished when you moved on, forcing fresh starts every time.
- Manual variable input: Every debug required typing all variables for that node, with no way to reuse upstream results.
- Limited view: You had to check logs node by node, never seeing the full data picture.
- Expensive reruns: Finding issues meant restarting entire workflows, including costly API calls that already worked.
When workflows fell short, developers became detectives, checking each node’s output to find the problem. This reactive approach wastes development time and forces teams to build on guesswork rather than solid understanding.
The Upgrade
Dify v.1.5.0 tackles this head-on with a true WYSIWYG development environment:
Last Run Tracking and Step-by-Step Control
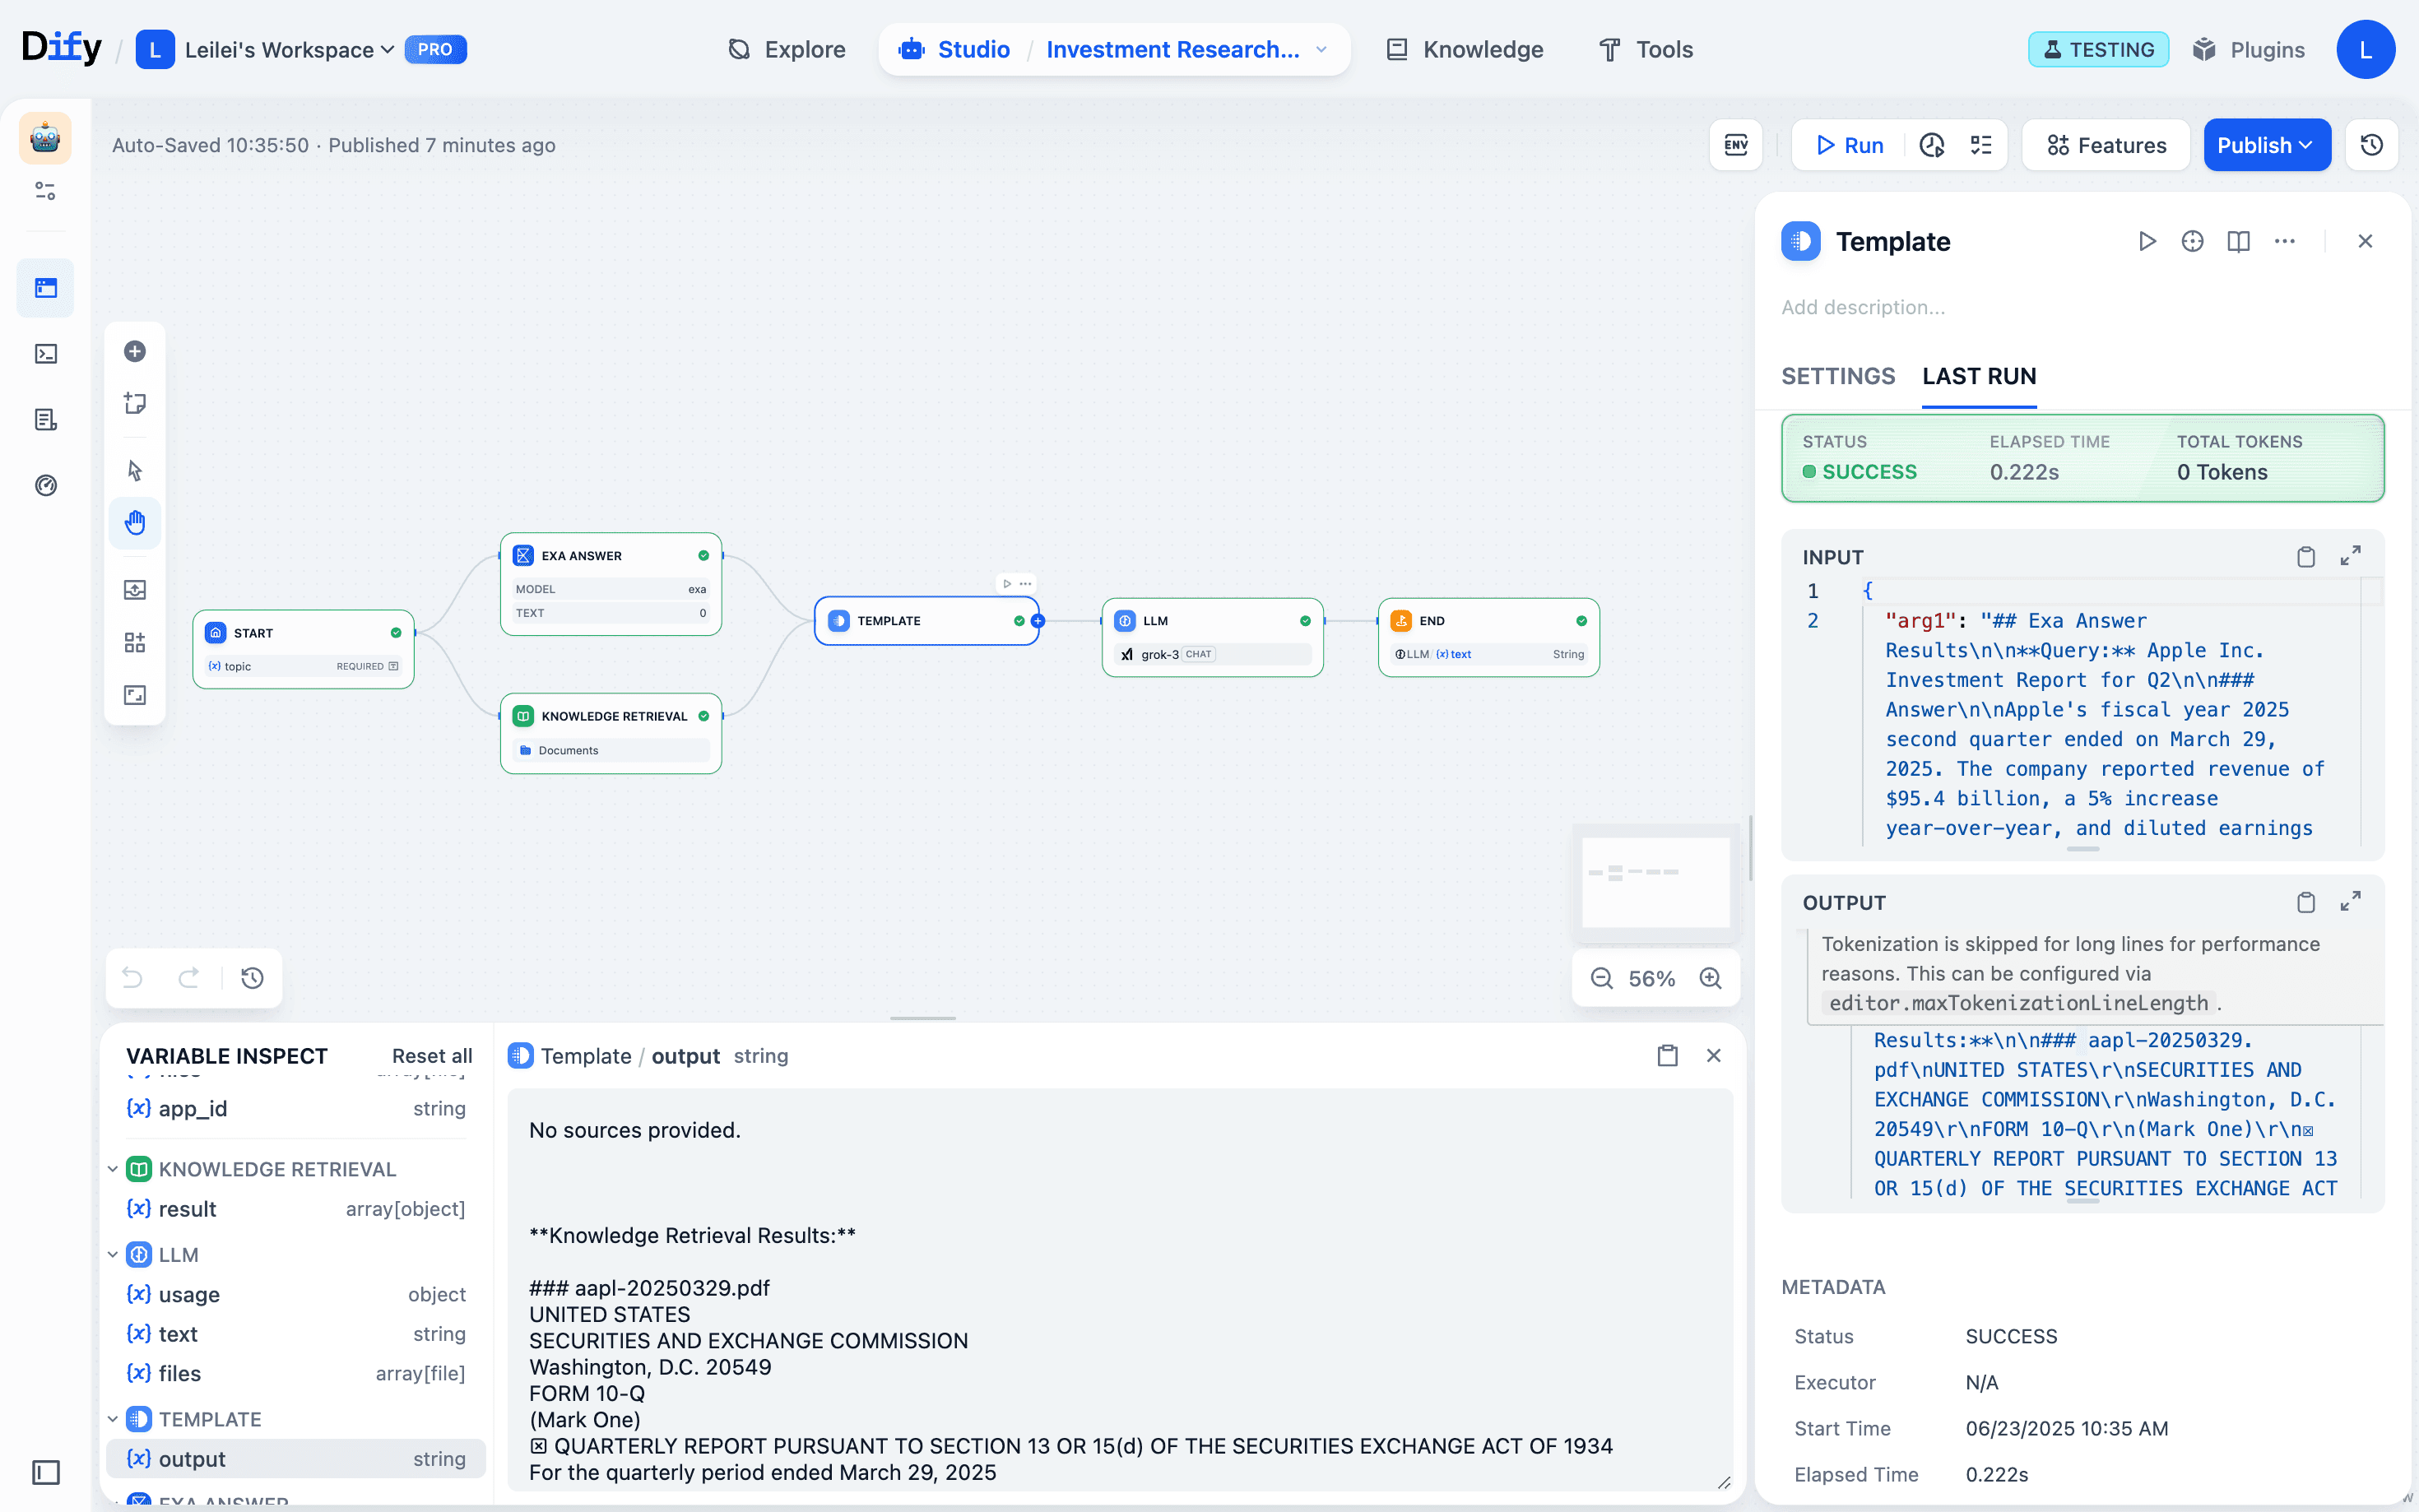
Last Run: Every node now saves its last successful execution automatically. Whether you run single steps or blast through the entire workflow, each node captures its inputs, outputs, and metadata from that run. Think of it as a flight recorder for every node: gives you solid, traceable evidence of what actually happened during debugging or full runs.
Variable Handoff: This tracking enables real step-by-step execution. When the variable inspect panel holds the data a node needs, you can run that node directly. The system grabs dependencies automatically and updates the monitor after execution. It works like running individual cells in Jupyter Notebook—pick any node, hit run, and the workflow handles all the data relationships.
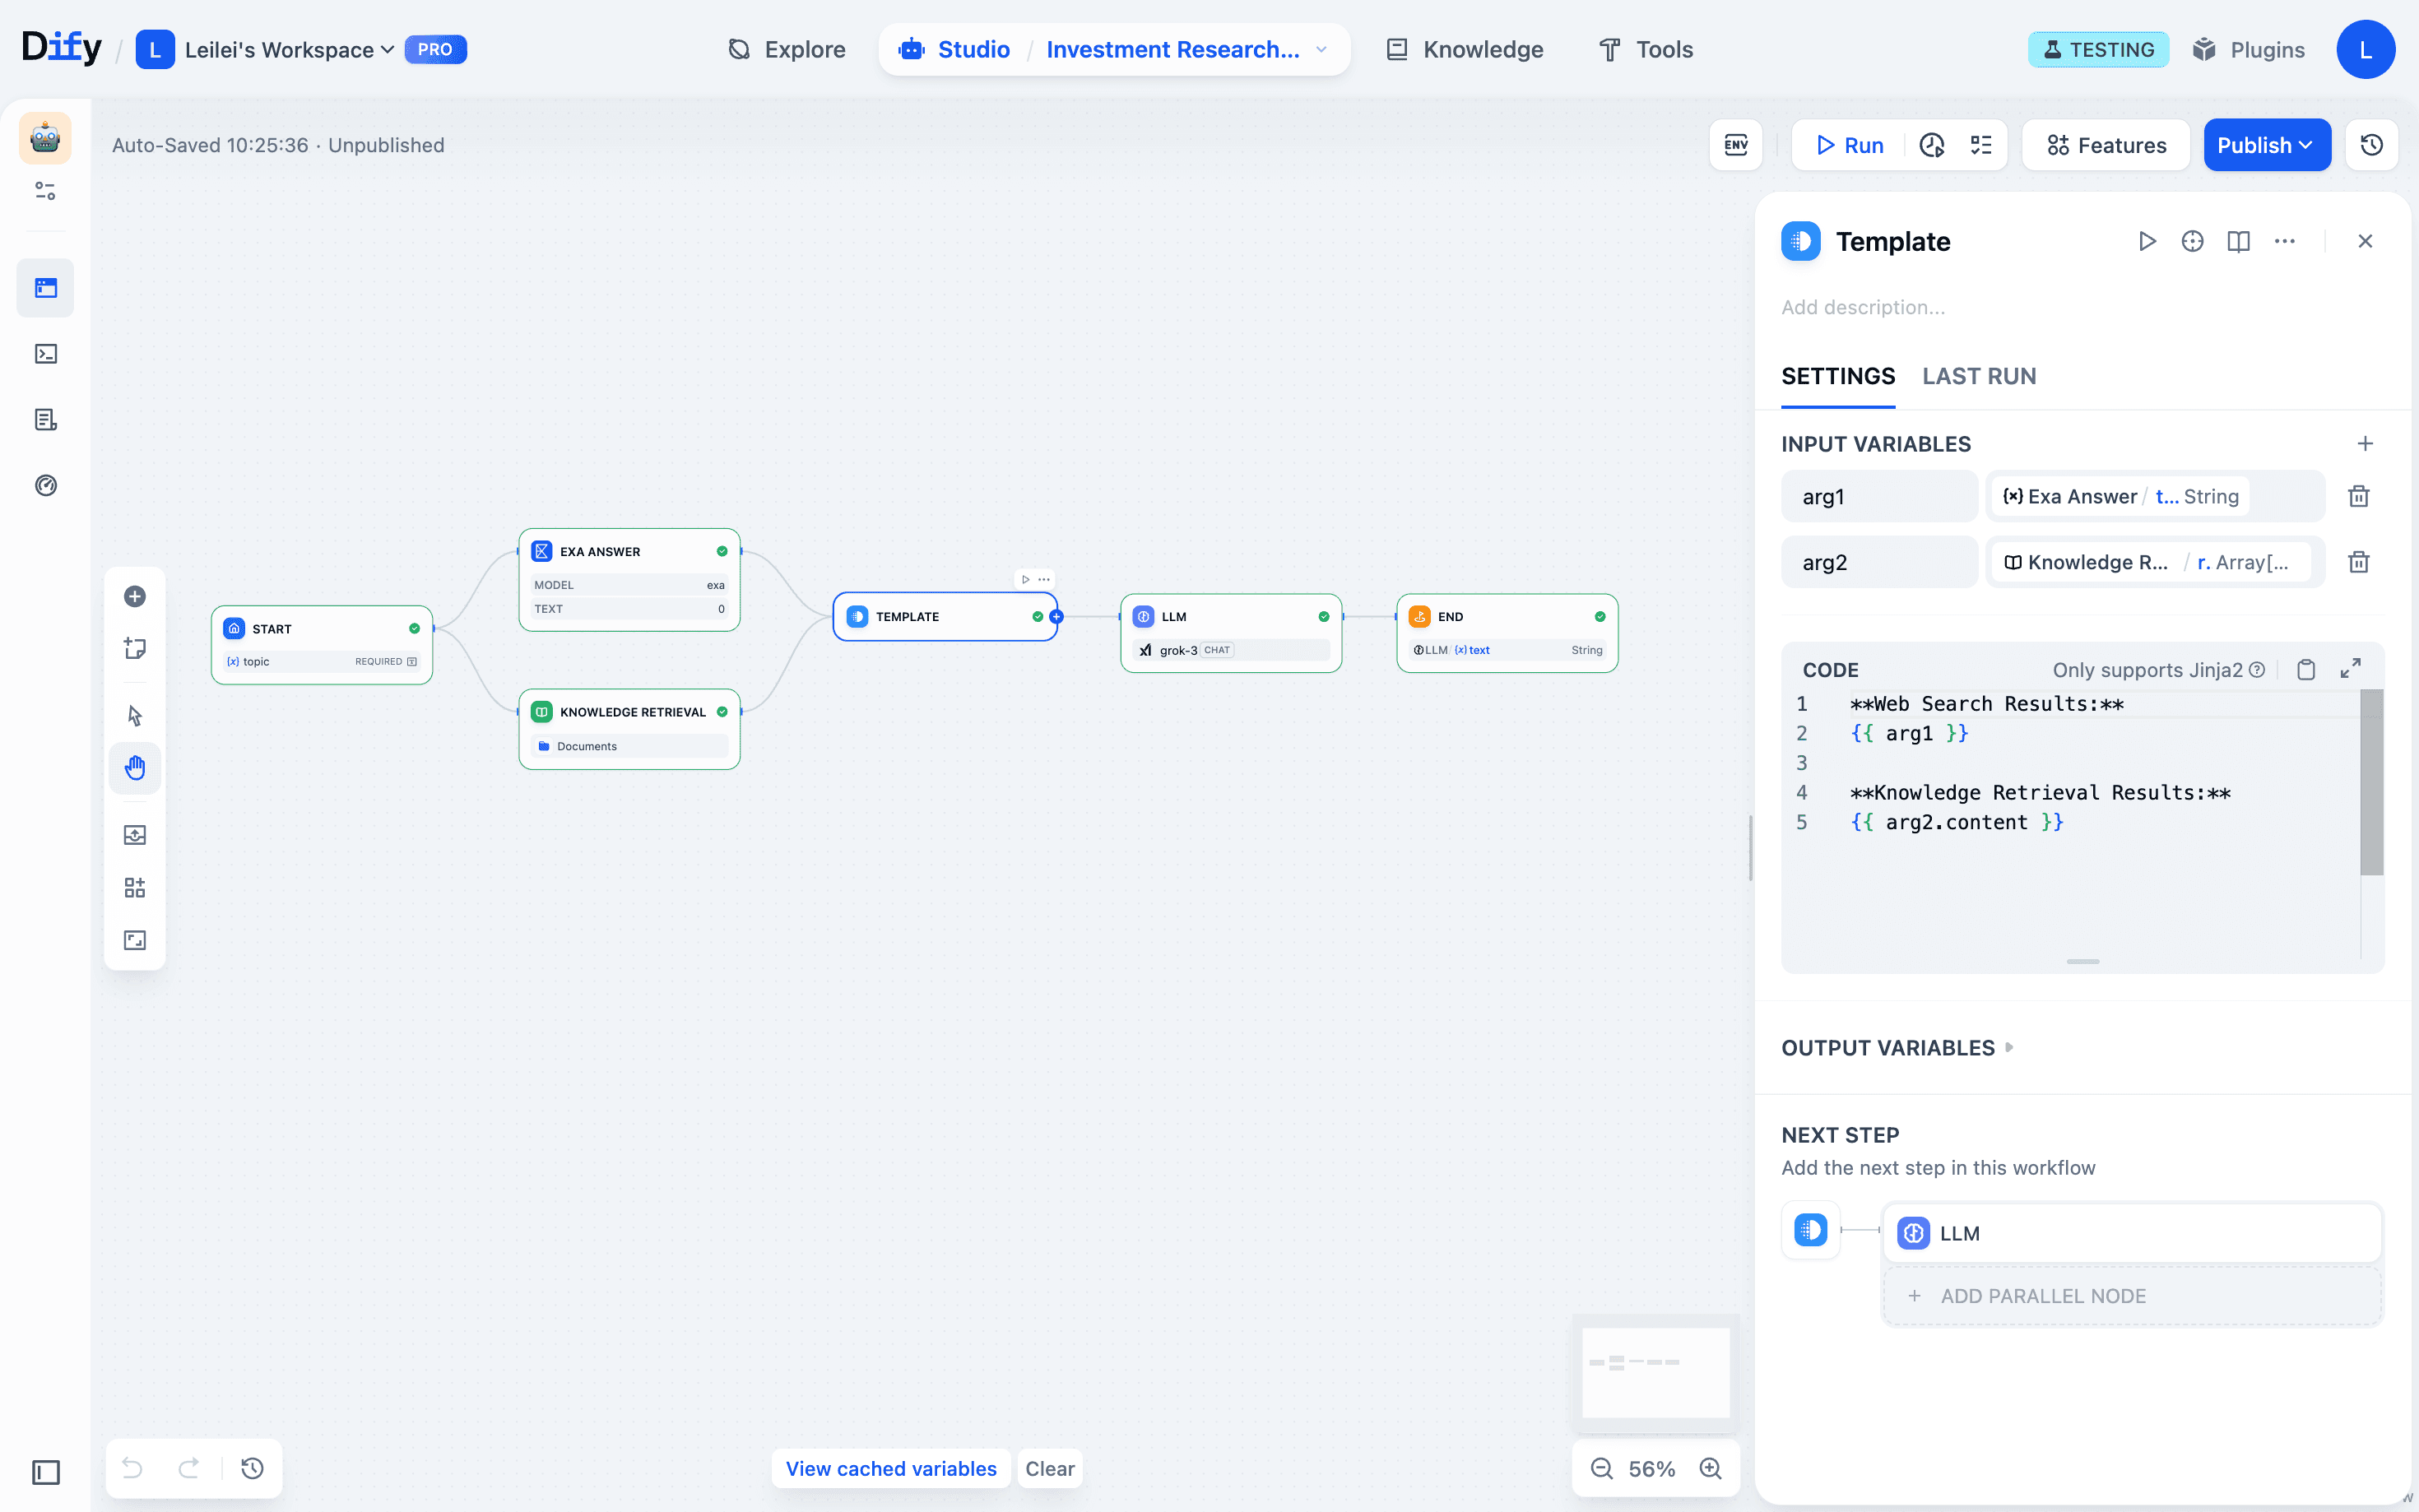
Variable Inspect Panel
We added a Variable Inspect panel at the bottom of the canvas. This global control center shows all variables and their contents in real-time across your entire workflow. No more hunting through node inputs and outputs, since everything sits in one clear view.
The real power comes from direct editing. You can modify most variable values right in the monitor, testing how different data affects downstream nodes without rerunning expensive upstream operations like complex LLM calls or API requests.
These two upgrades work together to make workflow development more transparent. Every node’s state gets saved and visualized, and every debug session targets the exact issue and verifies fixes quickly. Complex AI application development becomes as straightforward as snapping together building blocks.
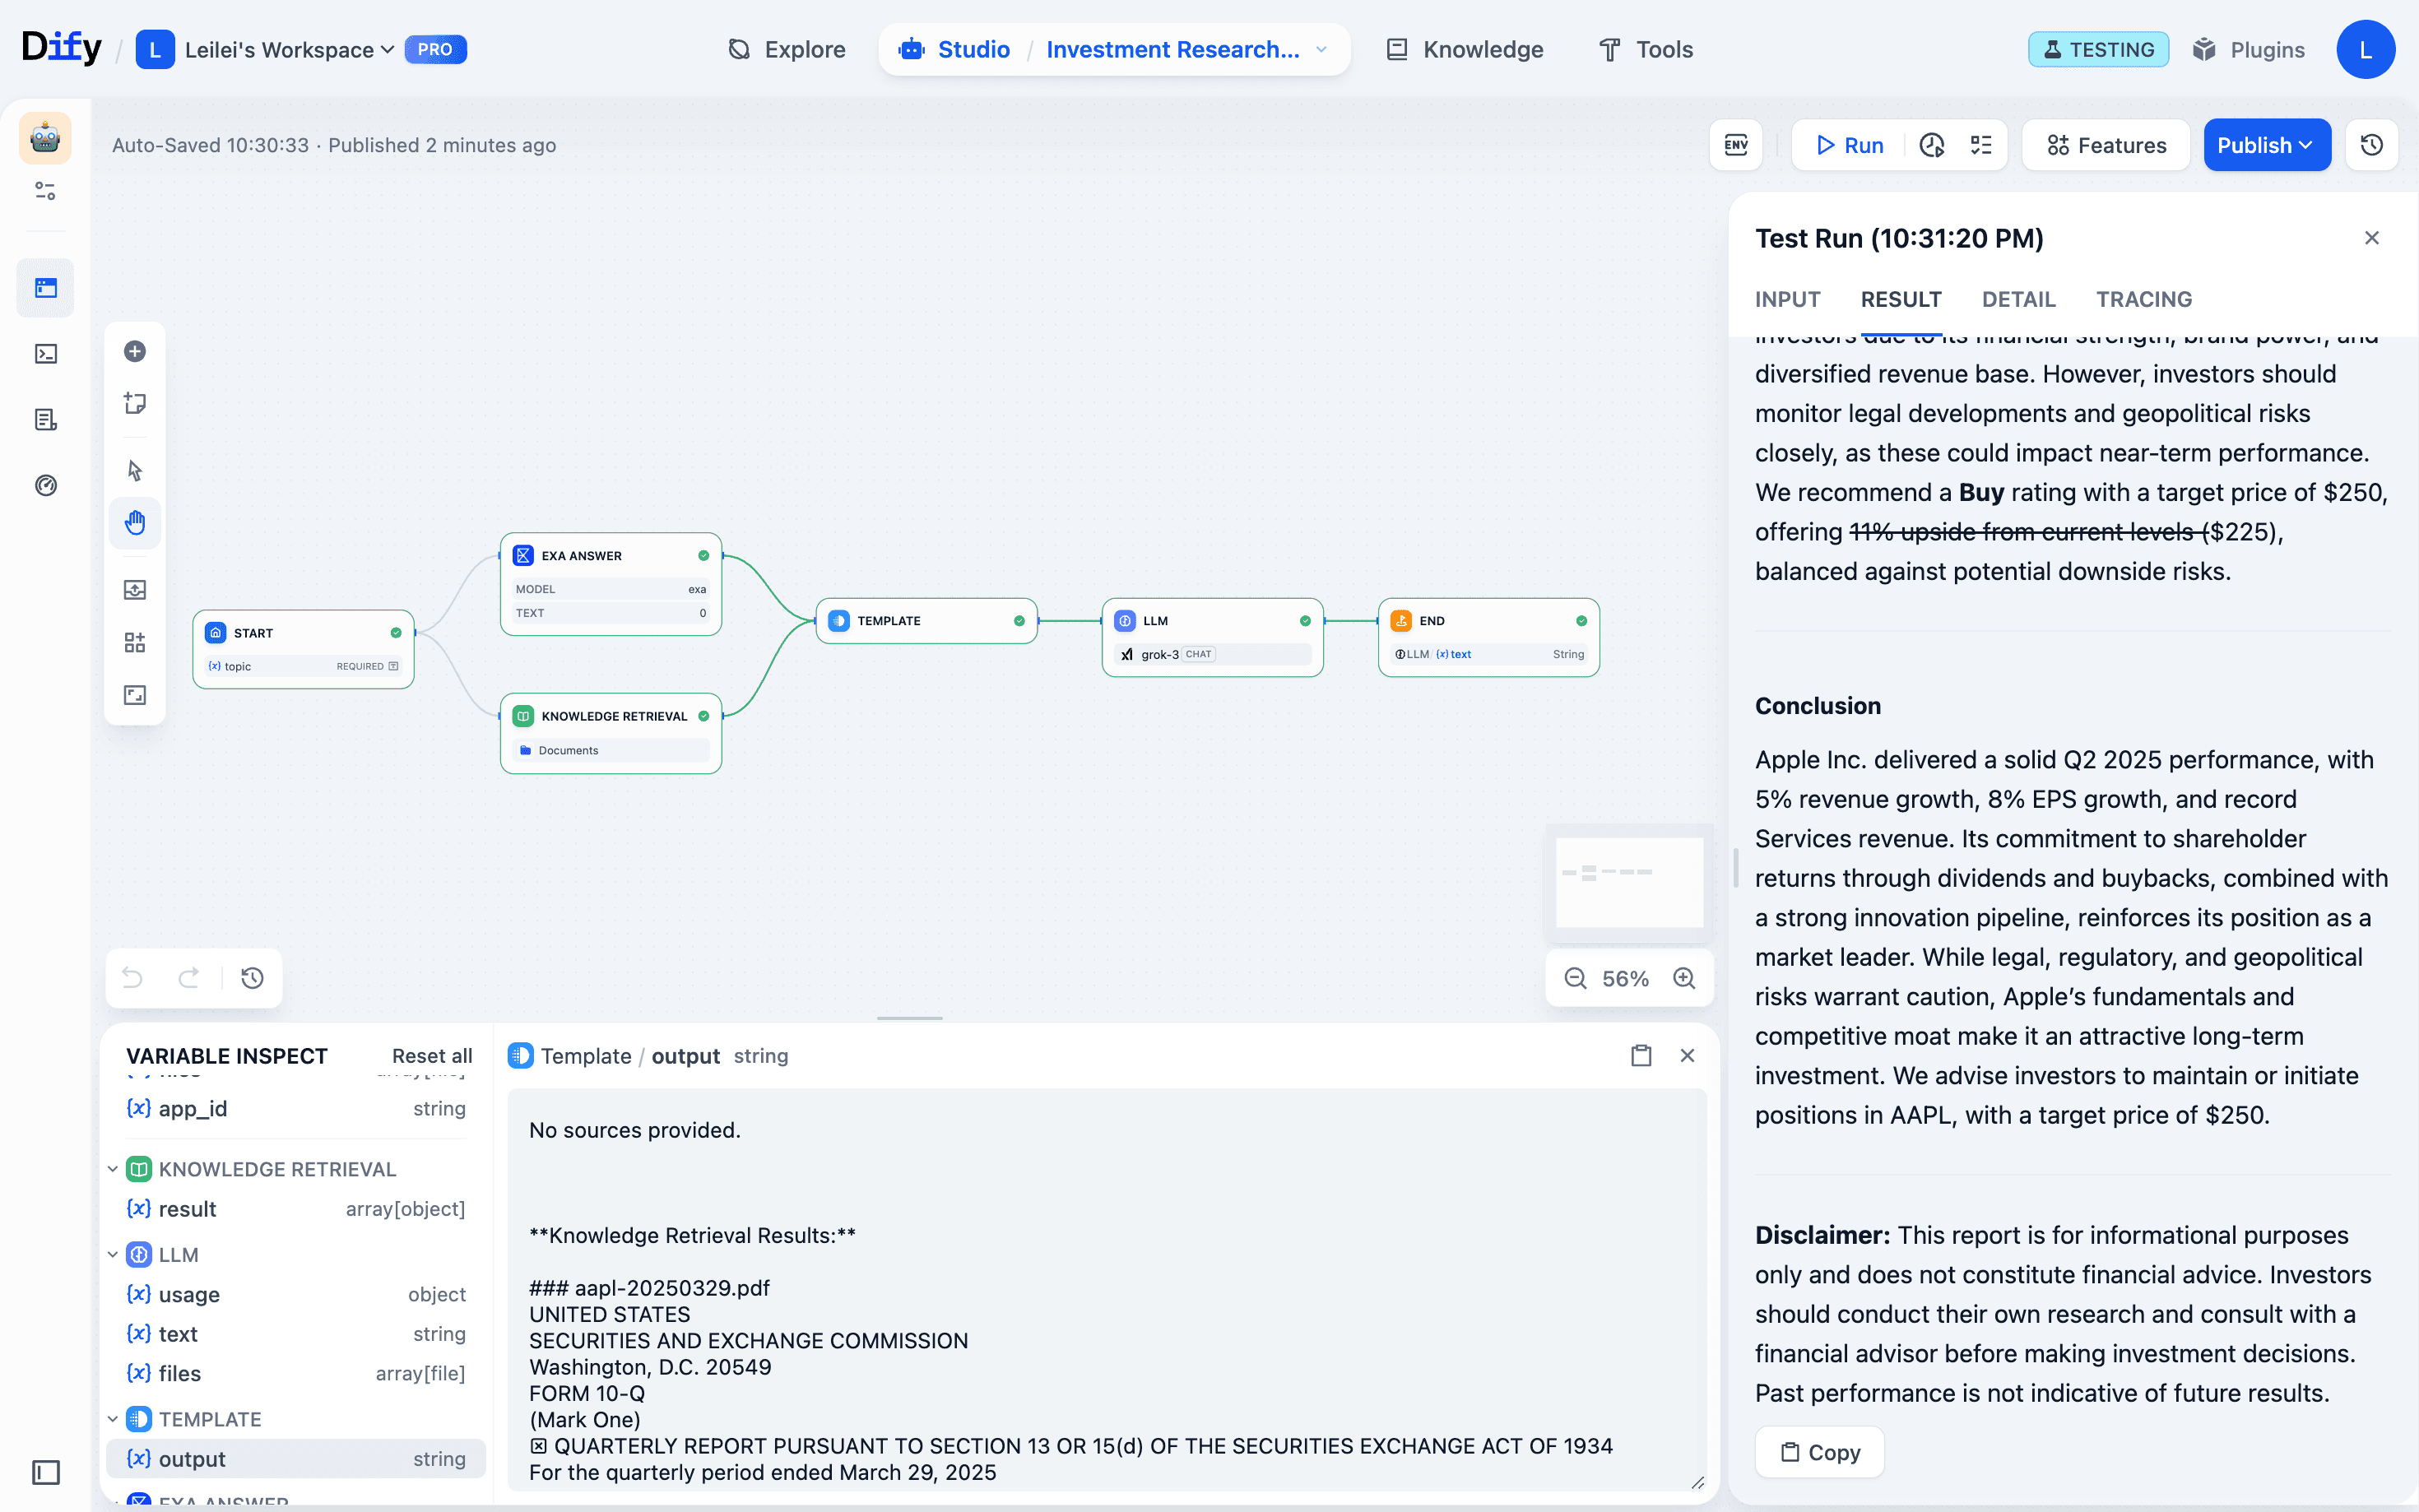
Real-World Test: Building an AI Investment Research Assistant
Let’s see this new approach in action with a concrete example.
We are building an AI investment research assistant with this workflow:
Start → Knowledge retrieval pulls financial reports from our database & Exa web scraper grabs internet data (parallel) → Template node merges content → LLM processes everything → Final output
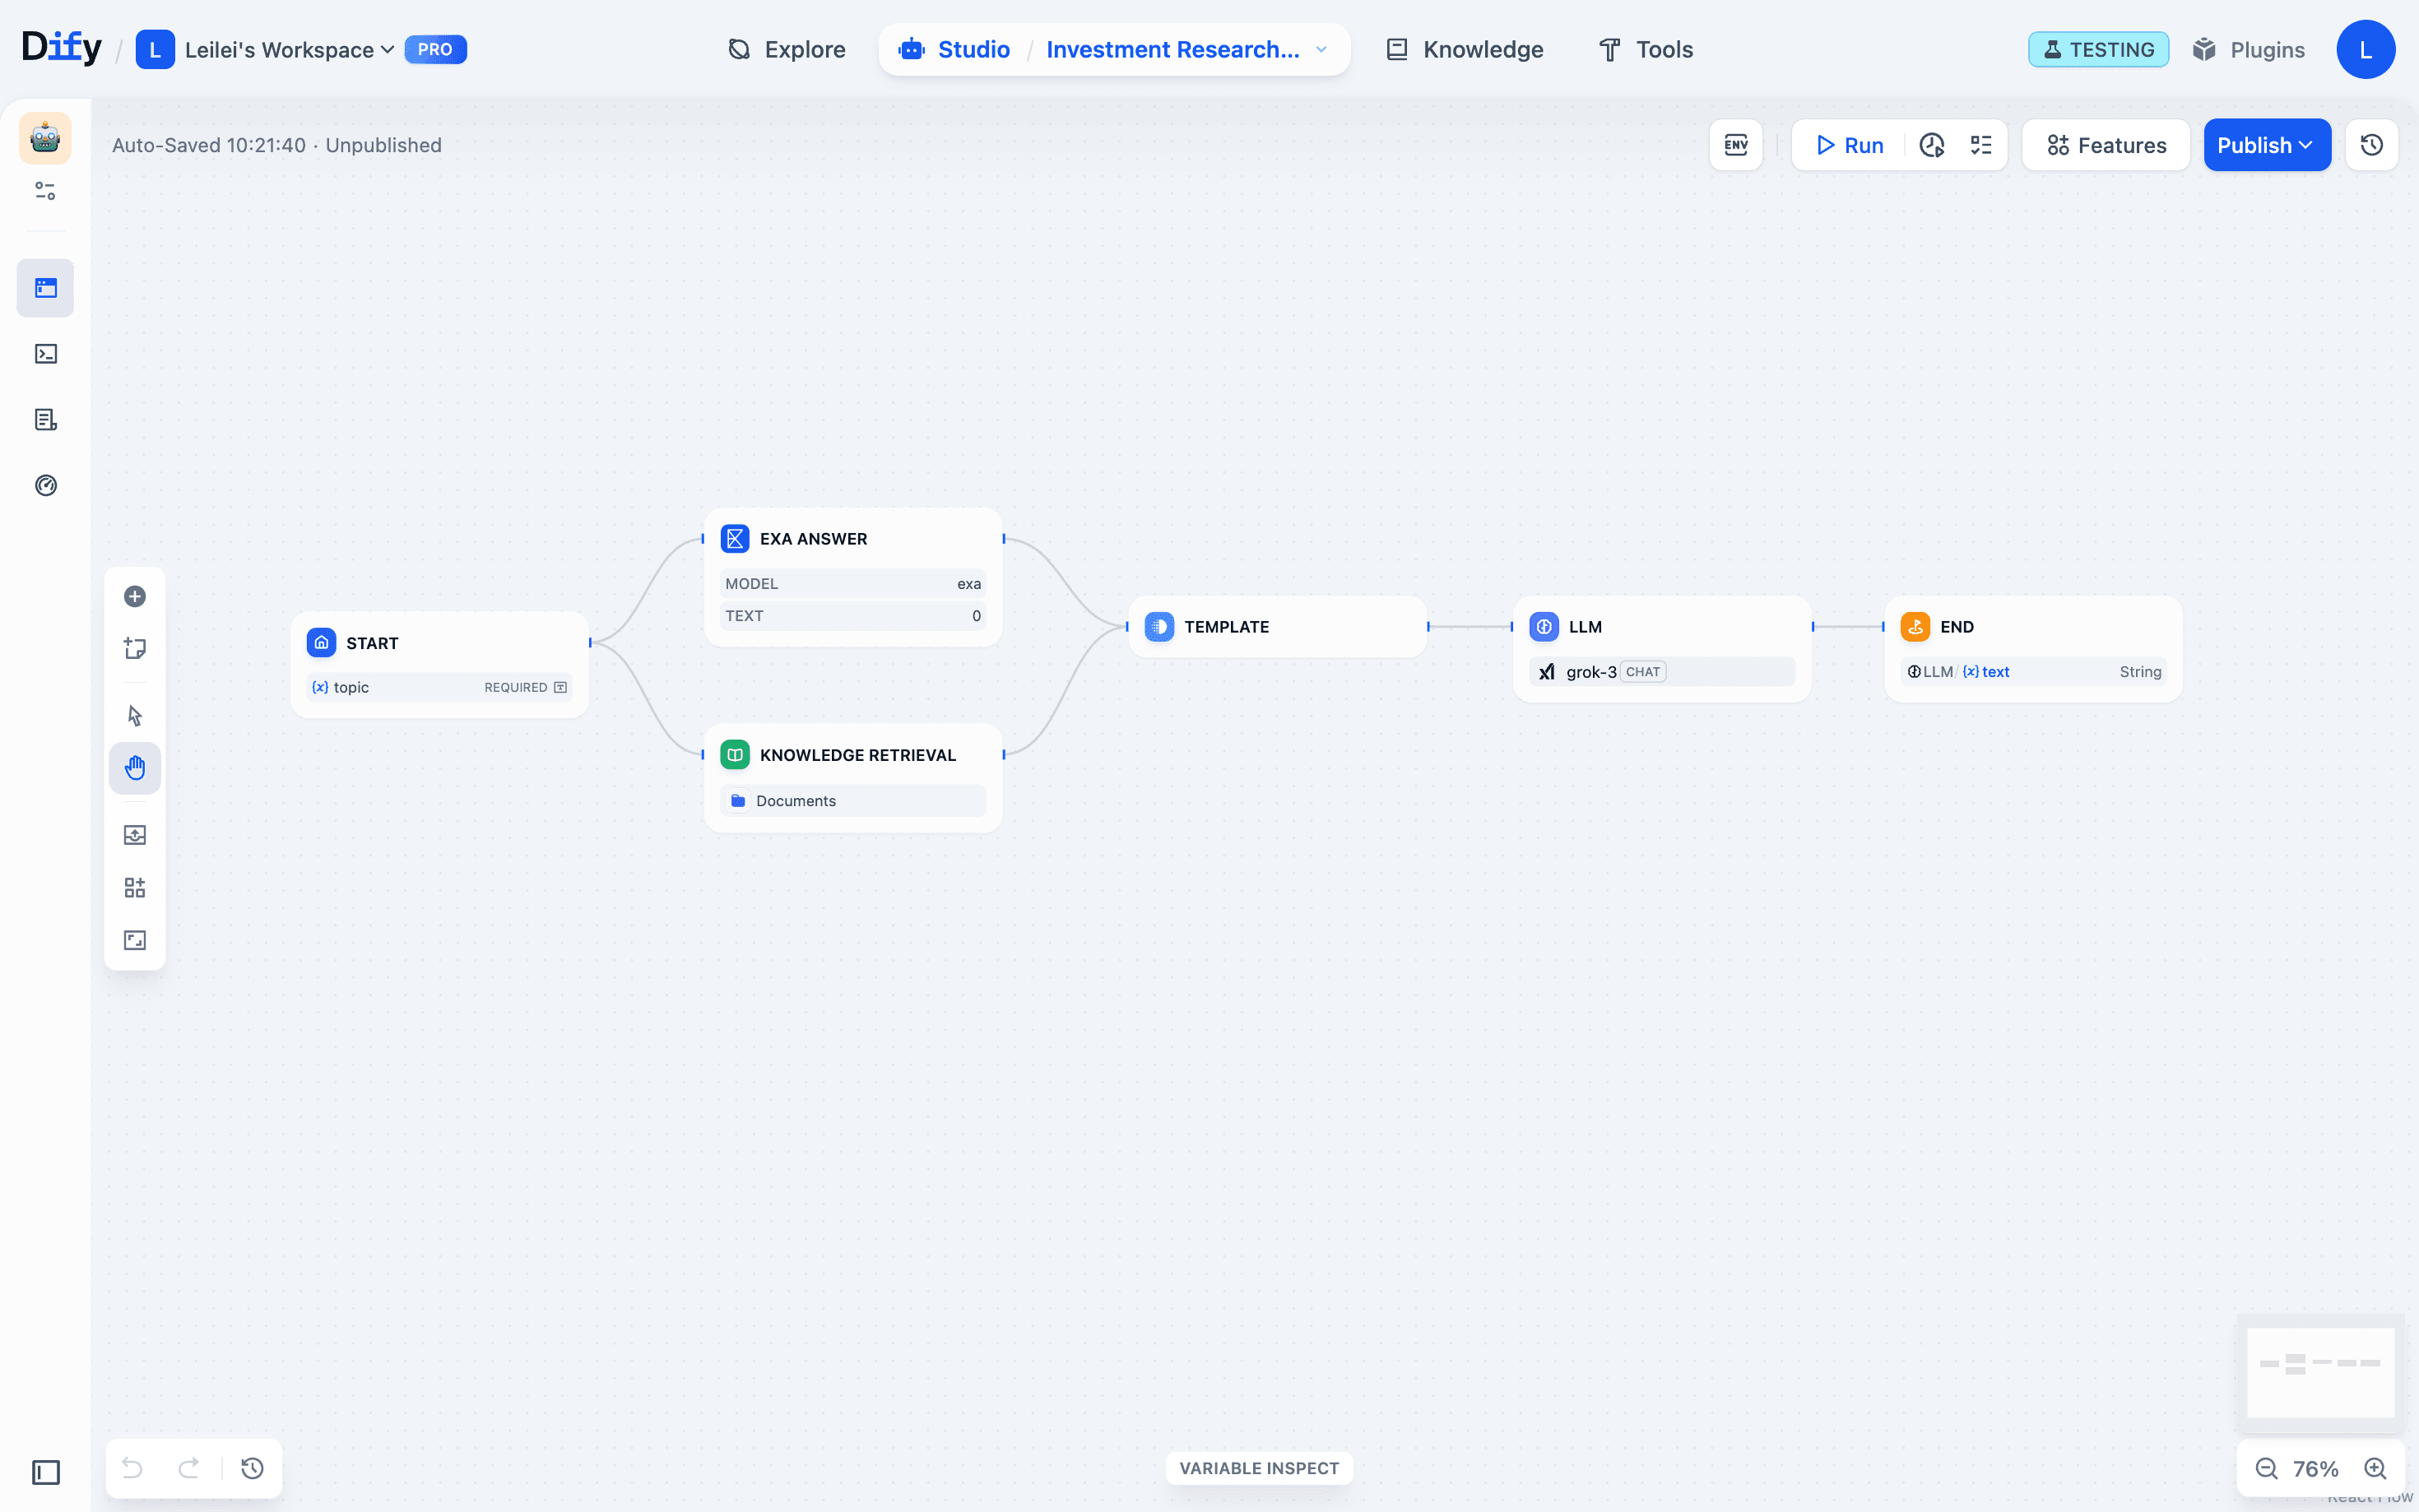
Here’s a common beginner mistake: You are not familiar with the knowledge retrieval output format, so your template node fails to properly include the database content. The template node runs fine, but the LLM gets incomplete input because it is missing some key data. Result: mediocre output quality.
The Old Way
Previously, poor output quality meant a painful detective process:
Finding the problem: Dig through run history, click each node to check outputs, eventually discover the template node dropped the knowledge base content (even though it “worked”).
Fixing and testing: Head back to edit mode, fix the template code, then choose between two bad options:
- Rerun the entire workflow, including slow knowledge retrieval and web scraping.
- Debug just the LLM node, but manually type in the corrected template output.
Rinse and repeat: If you are still not happy with the results, you start the whole cycle again.
This burns time and racks up unnecessary API costs, especially during multi-round debugging sessions.
The New Way
Now you can do this:
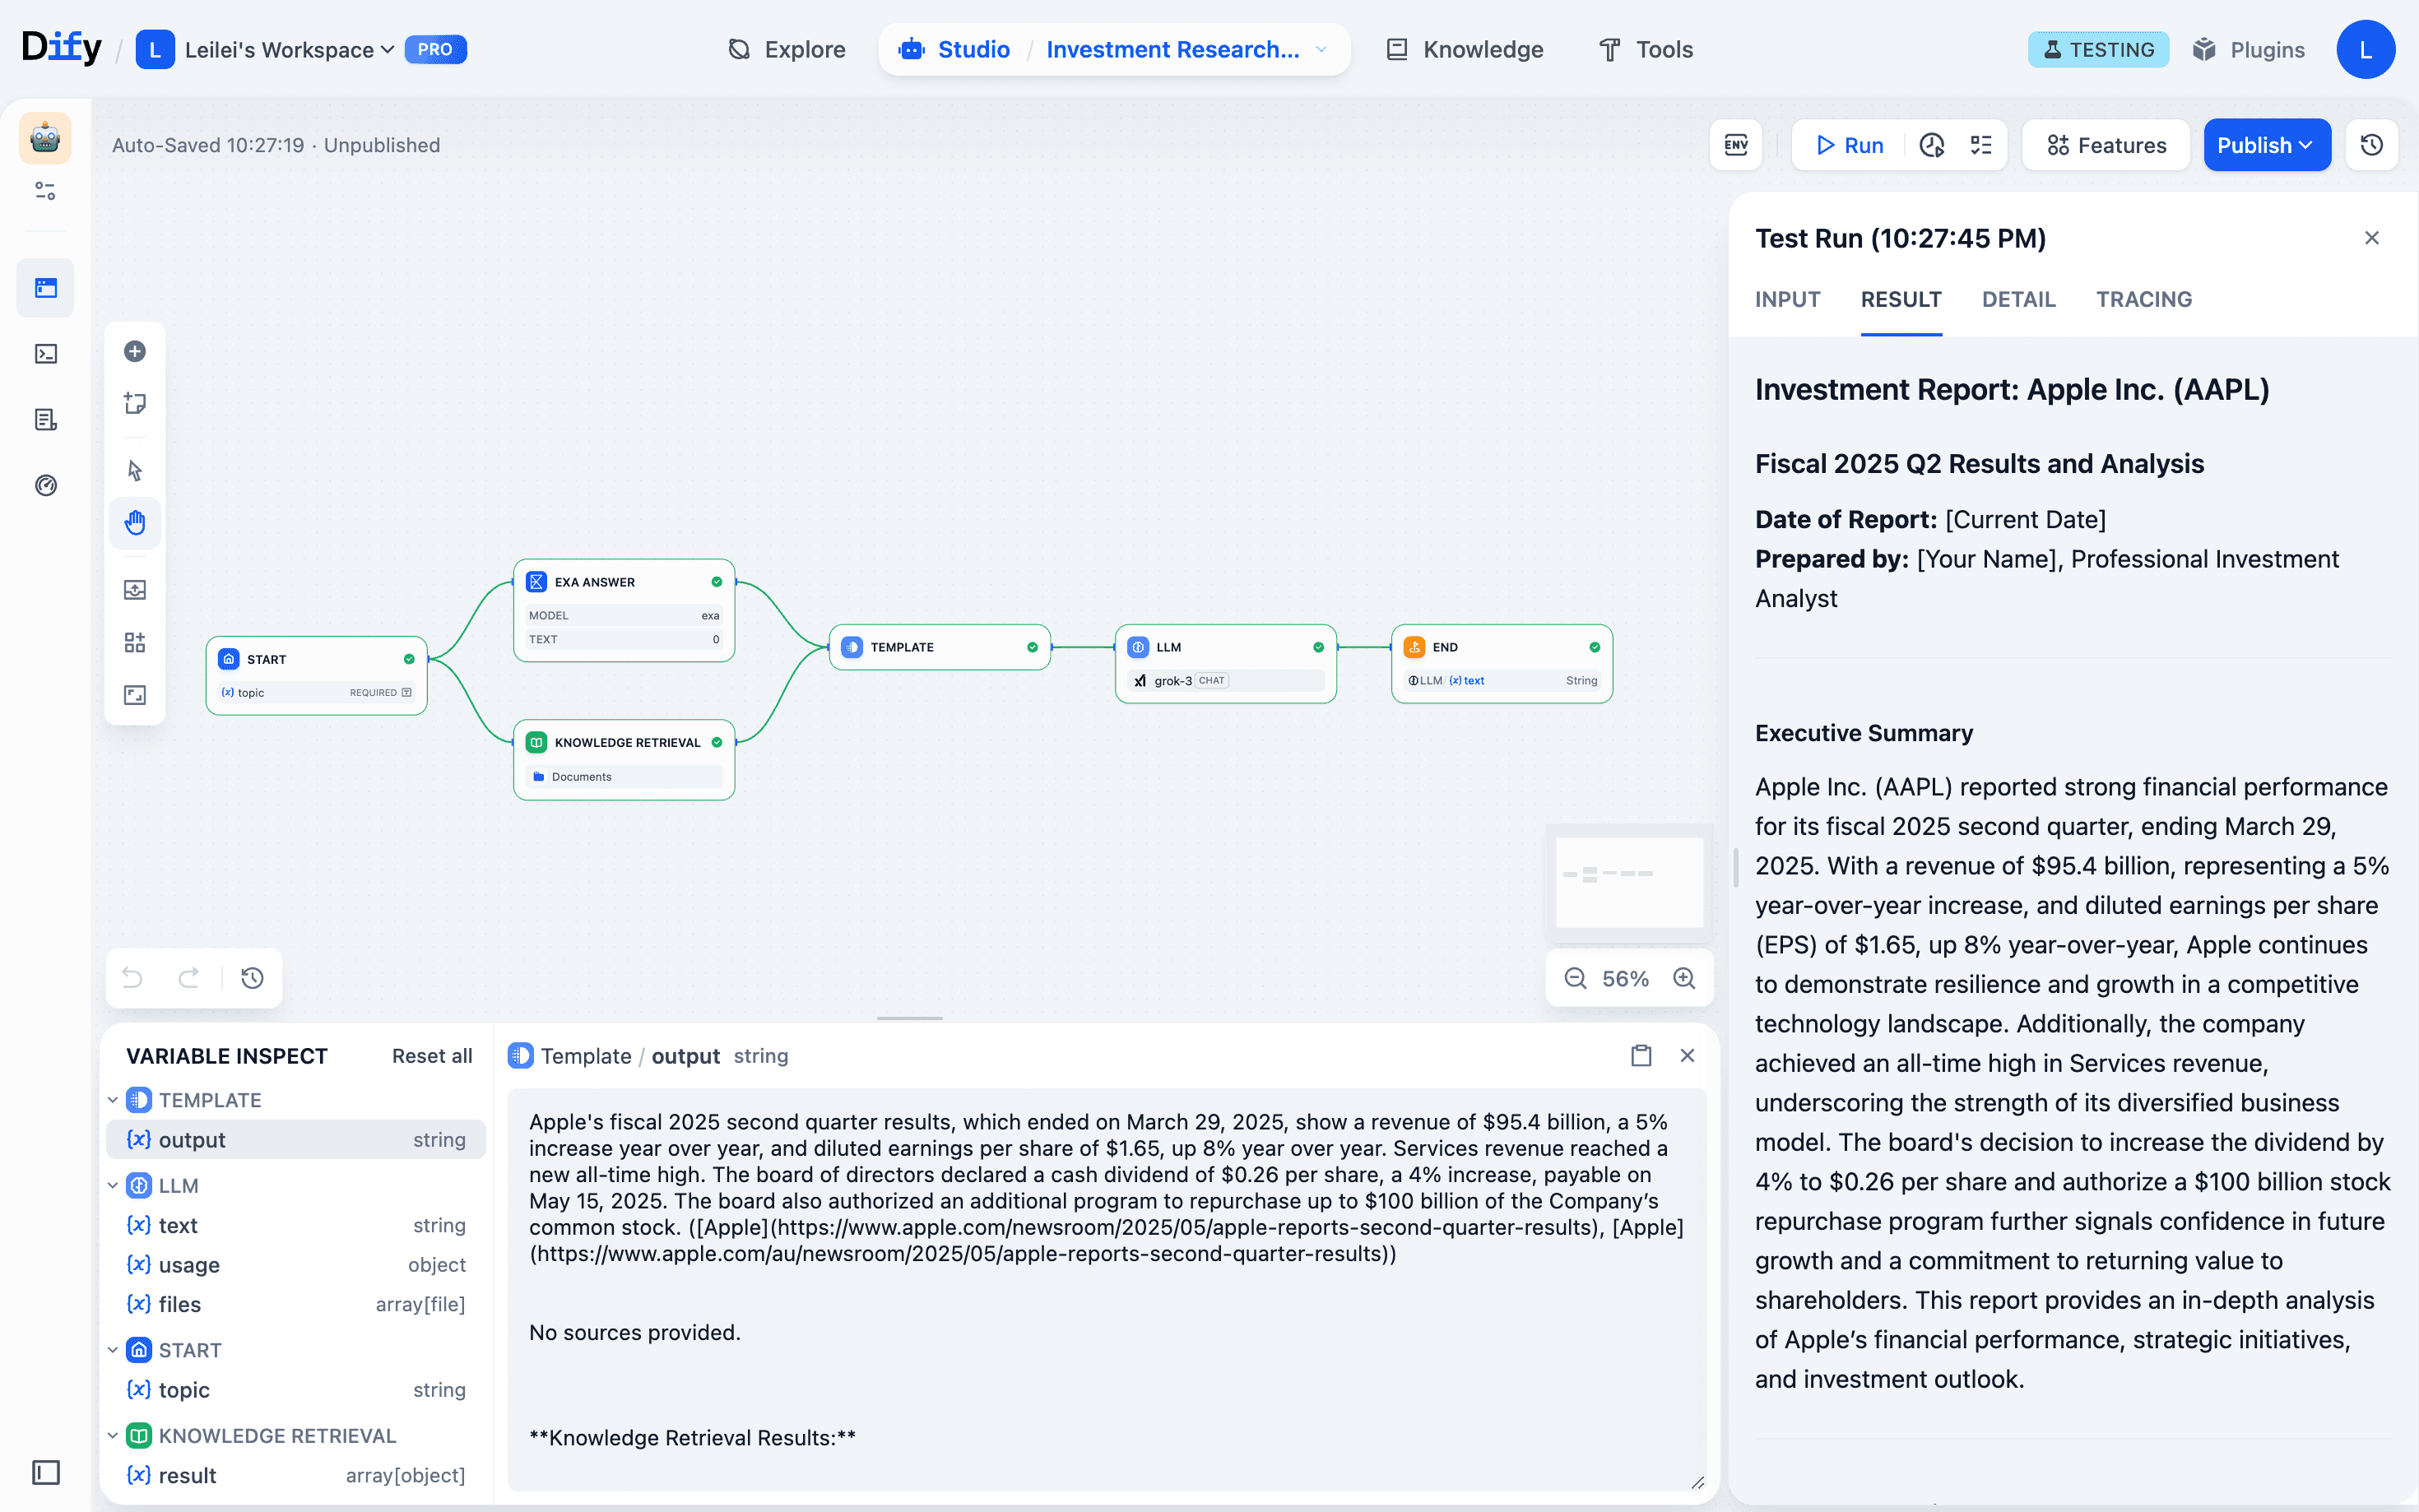
- Run the full workflow: Hit run once. Every node’s results get saved automatically to the variable monitor, giving you a clear view of all outputs.
- Spot issues: The variable inspect panel shows you immediately that Exa web search worked fine, but the template node output is missing knowledge base content.
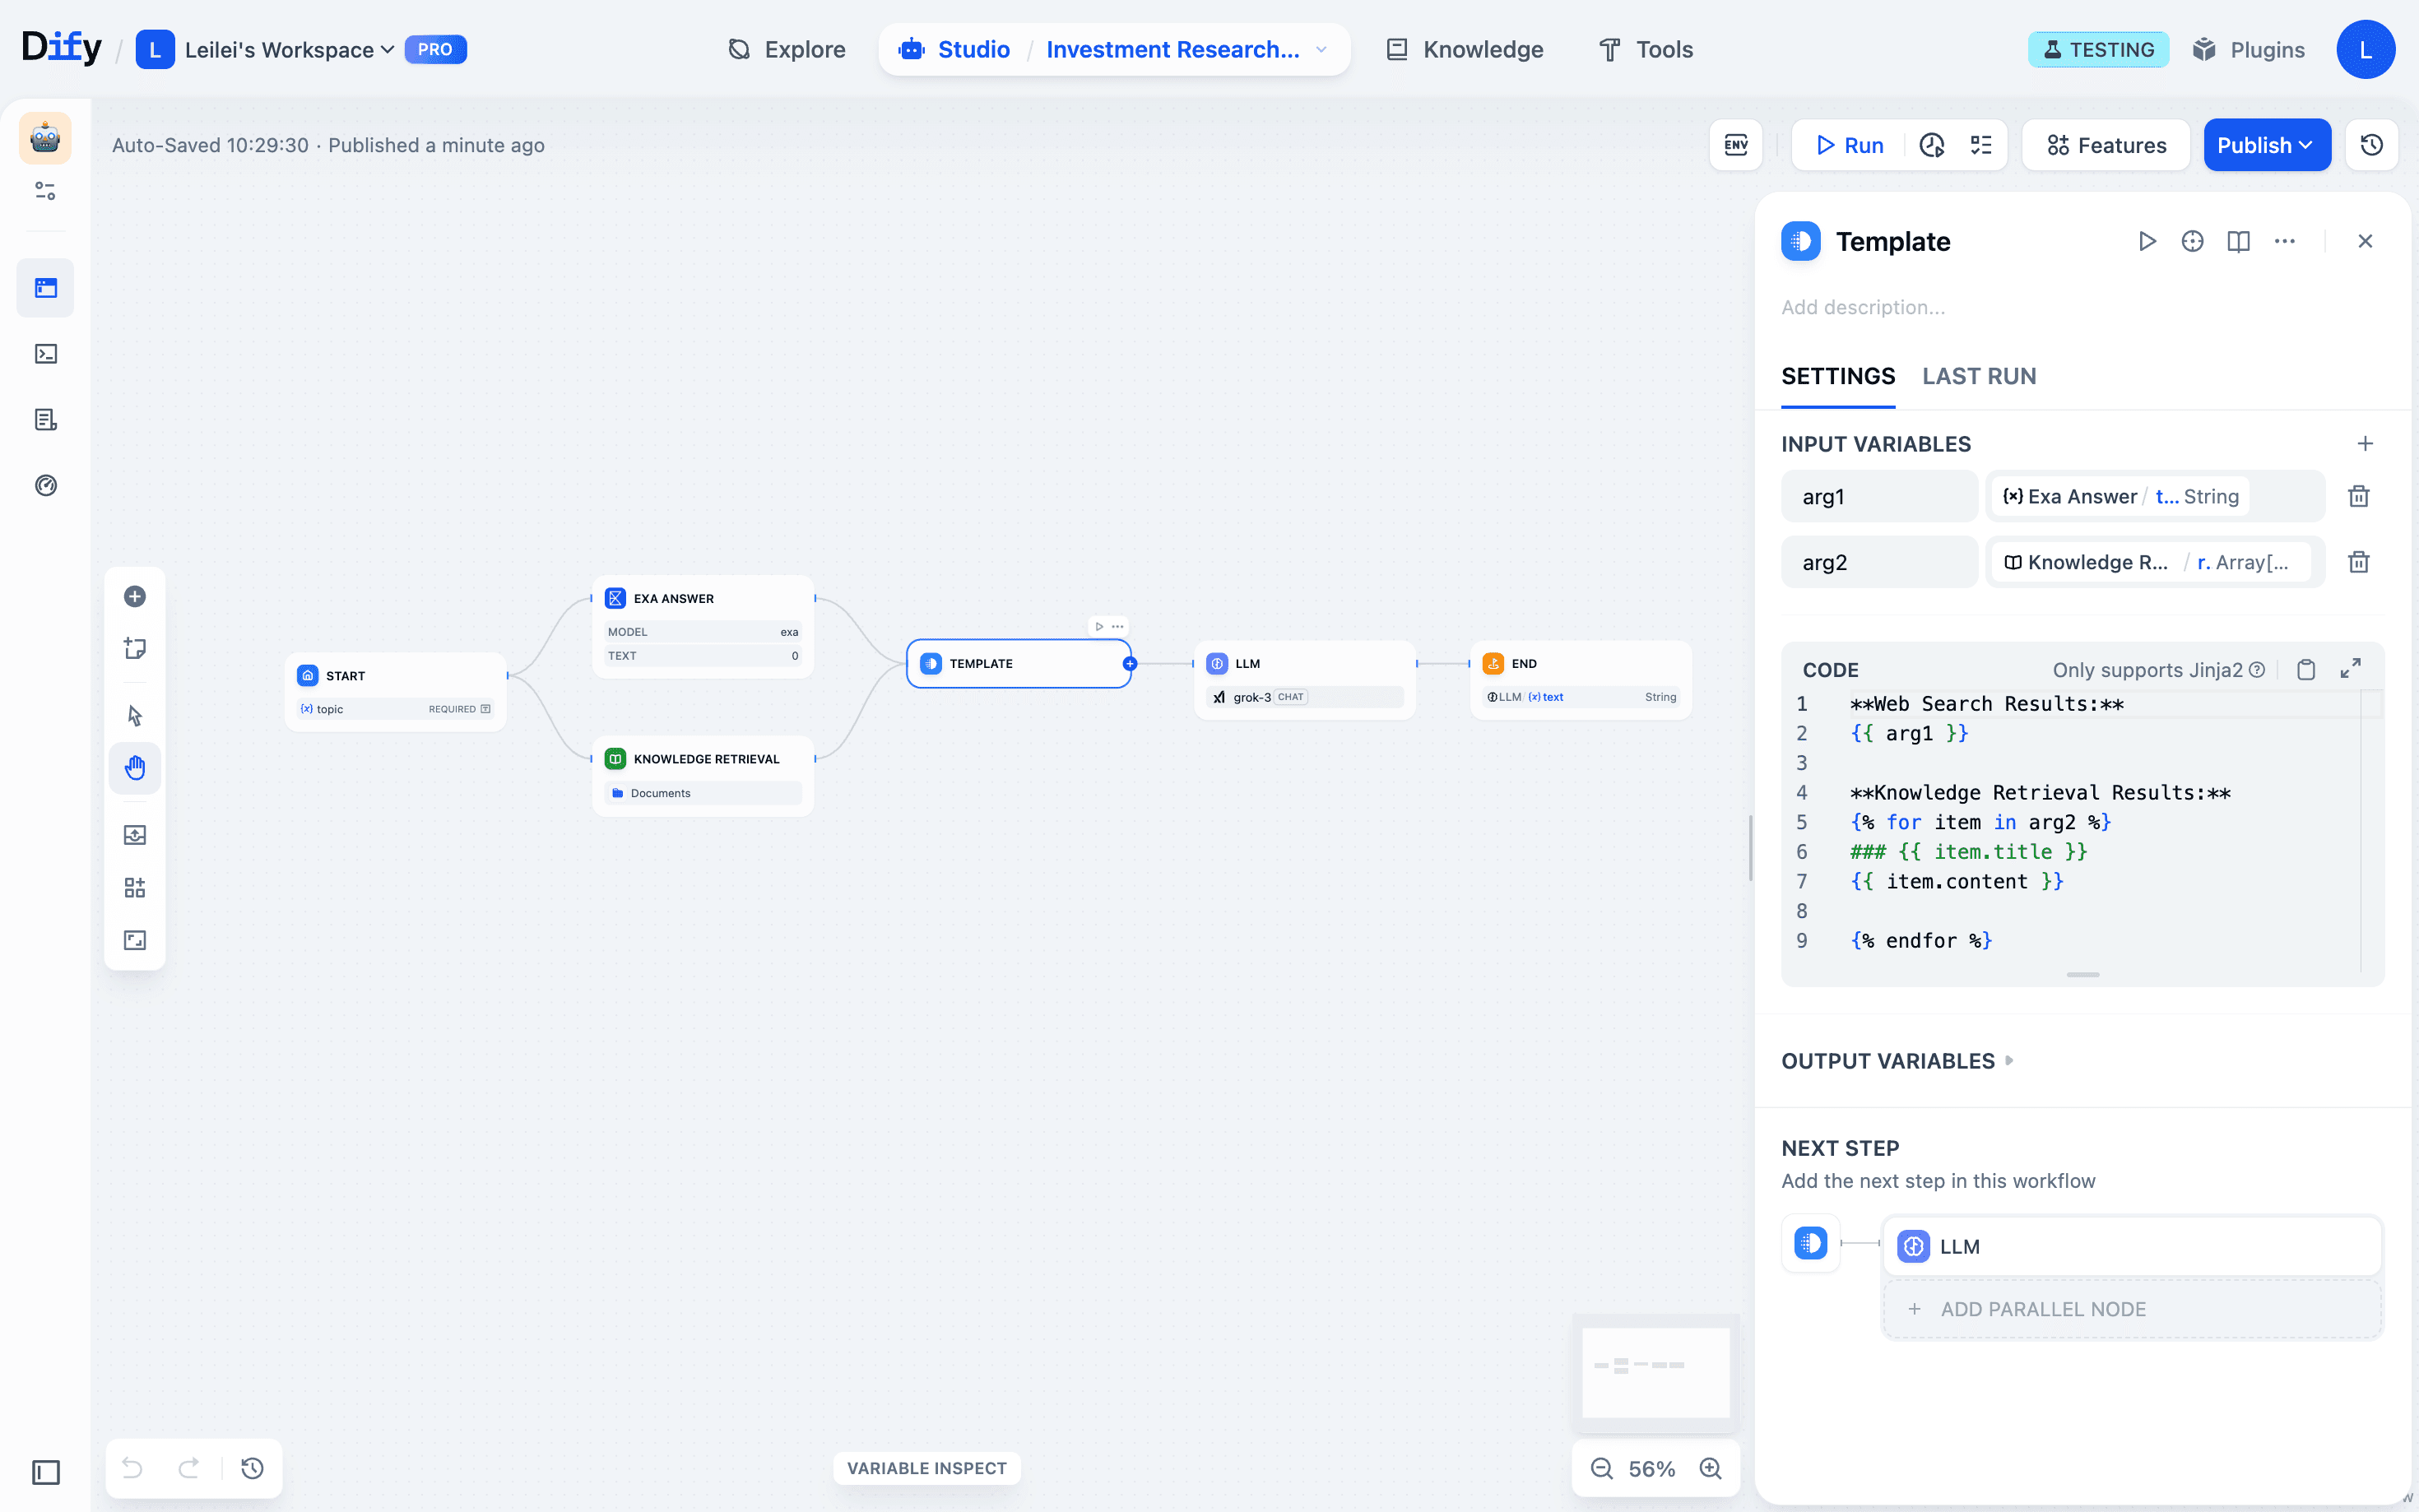
- Fix precisely: Patch the template node code to properly integrate knowledge base data.
- Test in steps:
- Run just the template node: It grabs upstream data from the monitor automatically and updates its output
- Run just the LLM node: It automatically uses the fixed template output as input. You see results instantly, no upstream reruns needed.
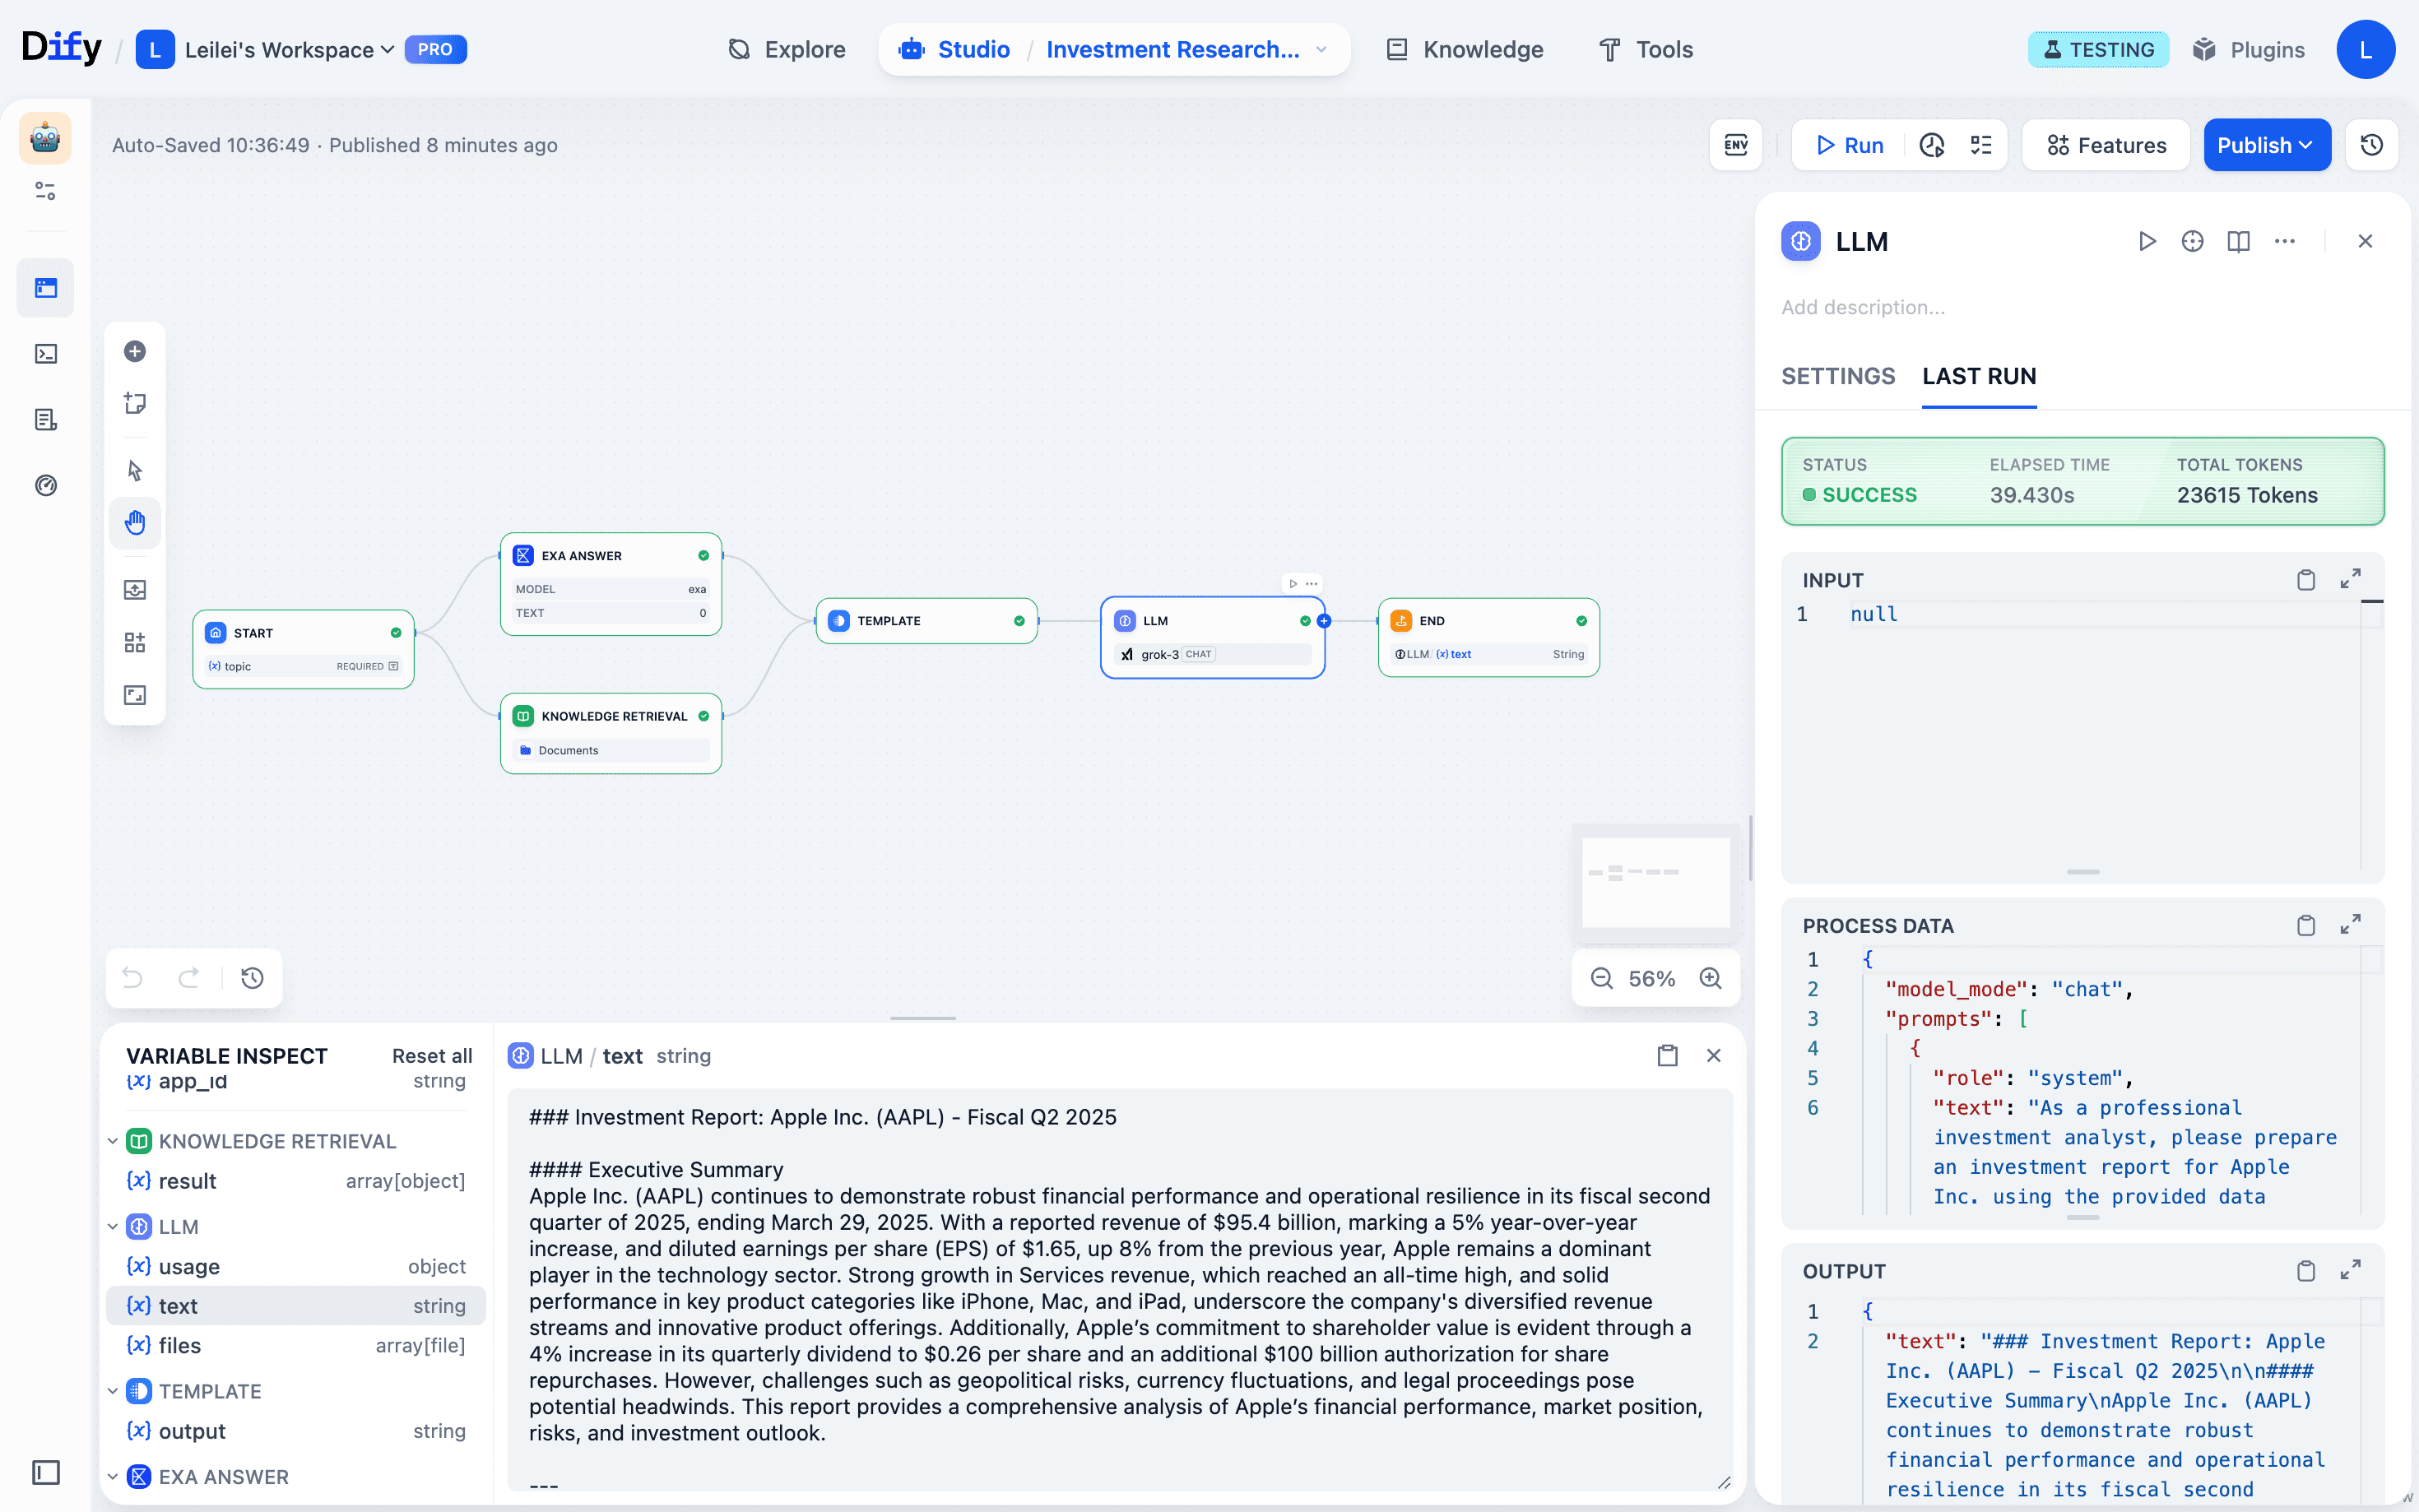
- Keep iterating: If LLM output still needs work, you can tweak the prompt design and rerun just that node. Each change takes seconds to verify.
The Difference
Old process: Find problem → Hunt through history → Type variables manually → Debug steps → Reconfigure → Rerun workflow → Check results (repeat as needed)
New process: Find problem → Check variable inspect panel → Fix node or edit variables directly → Run single step → See results immediately
What used to take dozens of minutes now takes just a few. The efficiency gains are obvious.
Summary
We hope Dify 1.5.0’s core upgrade brings certainty and visibility to complex AI development. With real-time interaction and transparent state management, developers can verify ideas faster, pinpoint problems precisely, and build production-ready AI applications with confidence.
Related articles
- Product
Now on Dify Marketplace: Qubrid AI Brings Multi-Model Access to Every Dify Workflow
Install the Qubrid AI plugin on Dify to unlock unified access to DeepSeek, Kimi, Qwen, MiniMax, GLM, and more, all through one API key.

 Qubrid AI & Dify
 - Product
Grounding Dify Agents in Real Data: MongoDB Atlas and Voyage AI Are Now Native to Dify RAG Workflows
Dify and MongoDB make it easier to build grounded AI agents that retrieve, reason over, and act on real business data, without stitching together custom RAG infrastructure from scratch.
 MongoDB & Dify
 - Product
Dify Creator Center & Template Marketplace: Share Your Workflows
Dify’s new Creator Center and Template Marketplace let creators publish workflow templates and users discover and one-click adopt them, with optional PartnerStack affiliate linking to earn recurring commissions from subscriptions driven by template links.
Dify - Product
Try OpenAI, Claude, Gemini & Grok Free on Dify Cloud
Supports OpenAI, Claude, Gemini, and Grok. Try curated templates with zero configuration.
Dify